During November 2024, the social network Bluesky underwent a significant transformation. What had been a platform where a few libraries set up experimental profiles with mixed results, suddenly became a space where many libraries were achieving substantial engagement.
In short, Bluesky has reached a critical mass, with enough users leaving Twitter and joining the platform for it be considered a legitimate X-replacement. This shift makes it worth considering setting up an account for your institution. At one point Bluesky saw a million new users joining daily: for libraries—and cultural organisations in general—this presents a unique opportunity to rebuild communities that have become harder to reach elsewhere.
There are plenty of examples of libraries finding success on Bluesky to draw inspiration from. I went from considering Bluesky to be brilliant for librarians but perhaps not yet suitable for libraries themselves, to seeing an explosion of library success that changed my mind. My own library has been on Bluesky for just over two weeks, and we've seen engagement levels far exceed what we experienced on Twitter over the past two years, as shown below.
If you’ve not seen Bluesky before, the first thing you’ll notice is how similar it is to Twitter in look and feel
And it’s not just us: others have posted comparisons showing engagement is much higher - and more positive - on Bluesky, and newspapers are finding click-throughs to their articles are way higher than on Twitter or Threads also, because links are not suppressed on the newer platform (see info on the lack of algorithm, below).
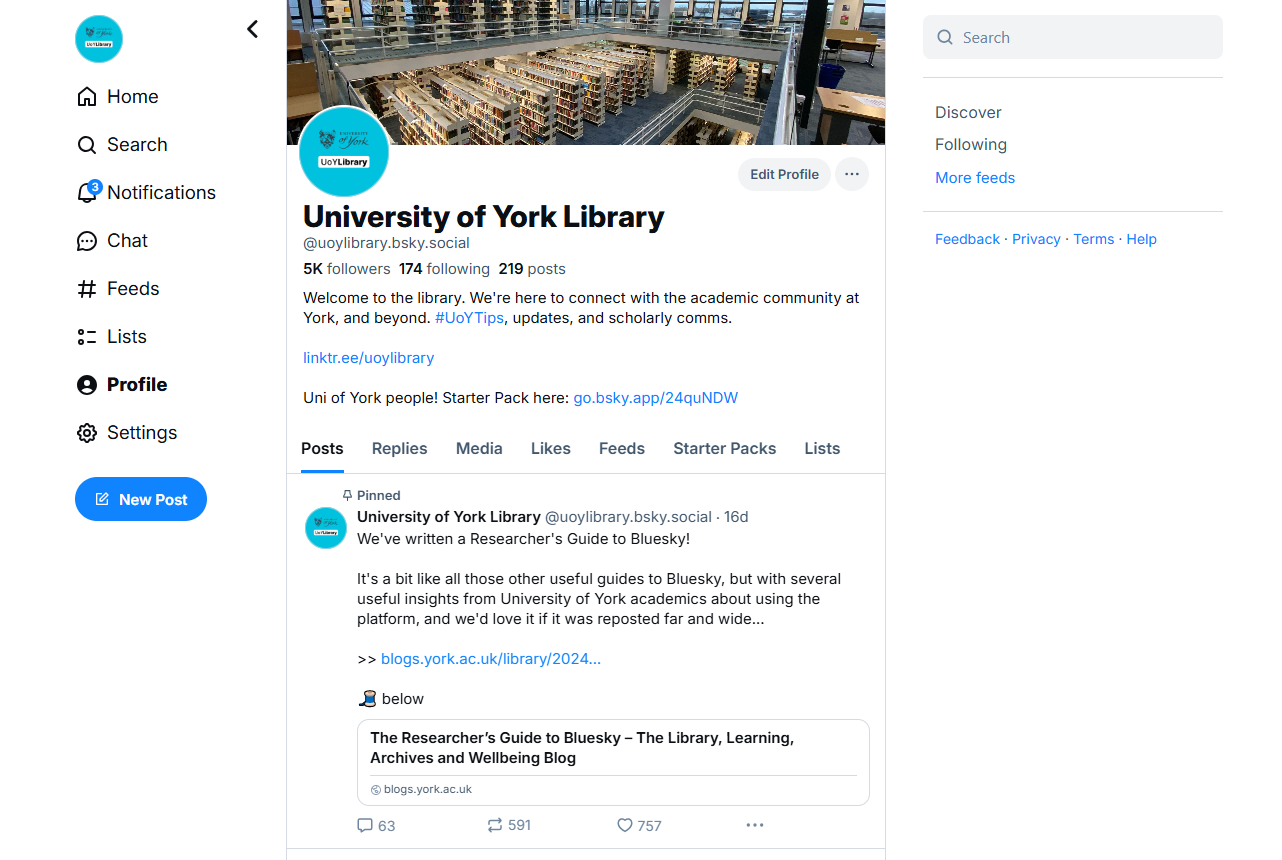
We’ve built a following quickly too, and while it’s not (yet) quite as big as our ex-X community was, it only took us 9 days to reach the total number of followers we had on Twitter after 9 years! Here’s how the first week went:

Our following numbers were helped by a very popular post (shown in the previous screenshot): a researcher’s guide to Bluesky. Being entertaining is good but being USEFUL is what leads to a larger following
So if you’re a cultural organisation and you’re either new to Bluesky, or considering setting up a profile, what do you need to know? Here’s a library guide to Bluesky: 13 tips to help you hit the ground running.
The big picture stuff
1. Learn from the organisations already active on Bluesky
You may be familiar with ‘Starter Packs’ on Bluesky - this is simply a curated collection of accounts, which you can follow all in one go. Use these to get a good idea of how comparable institutions are using the platform, and steal some of their ideas! I’d recommend pressing the ‘follow all’ button then unfollowing selectively as you go.
I’ve tried to think about what would be most useful for a nascent Bluesky library account, and settled on sector-by-sector Packs as the way forward so you can see what your immediate peers are up to, what sort of content works and gets engagement, and who is already having success. If you fall into the categories below and are not on these lists, tell me on Bluesky and I’ll add you!
Here they are:
The Academic Libraries Bluesky starter pack. Of all the sectors in libraries, the academic sector appears to be having the most success on Bluesky so far. This is not because of the nature of the content they’re posting, I don’t think - there’s just a lot of the academic community moving to the platform already.
If you work in an academic library, my uncomplicated recommendation is to get off Twitter, and get on to Bluesky.
Hopefully this starter pack will provide some inspiration from the libraries already making it work. (Please note there are also three other packs particularly relevant to this sector, none of which I created: the Open Research pack, and the University Presses pack, and the Archives and Special Collections pack.)
The Public Libraries Bluesky starter pack. This sector is starting to make its way on to the platform, although at the moment there’s a few libraries grabbing the username but not actively posting. In UK terms the two social media behemouths in public libraries are of course the British Library who have not been on Bluesky too long but have already amassed 20k followers, and Orkney who have only been here for 4 days but already past 5k! I love both those libraries and their social media output, but would caution against using them for too much inspiration as their huge followings and cultural cache slightly set them apart from an especially copyable model… I’d recommend checking out Hull Libraries as an example of a newish public library account making the platform work well. (I also see some public libraries having success with Threads, and would recommend choosing one platform or the other rather than spreading your time too thin across both.)
The Health Libraries Bluesky starter pack. Medical and health libraries are starting to arrive now, and I’ll keep adding them to this pack as they do - it will be interesting to see whether Bluesky or Instagram are the best use of the social media time available.
I’m yet to see enough School Libraries, Law Libraries or other Special Libraries to create Packs for those sectors - that will hopefully change over time. You’ll find recommendations for librarian (rather than library) starter packs in this separate guide.
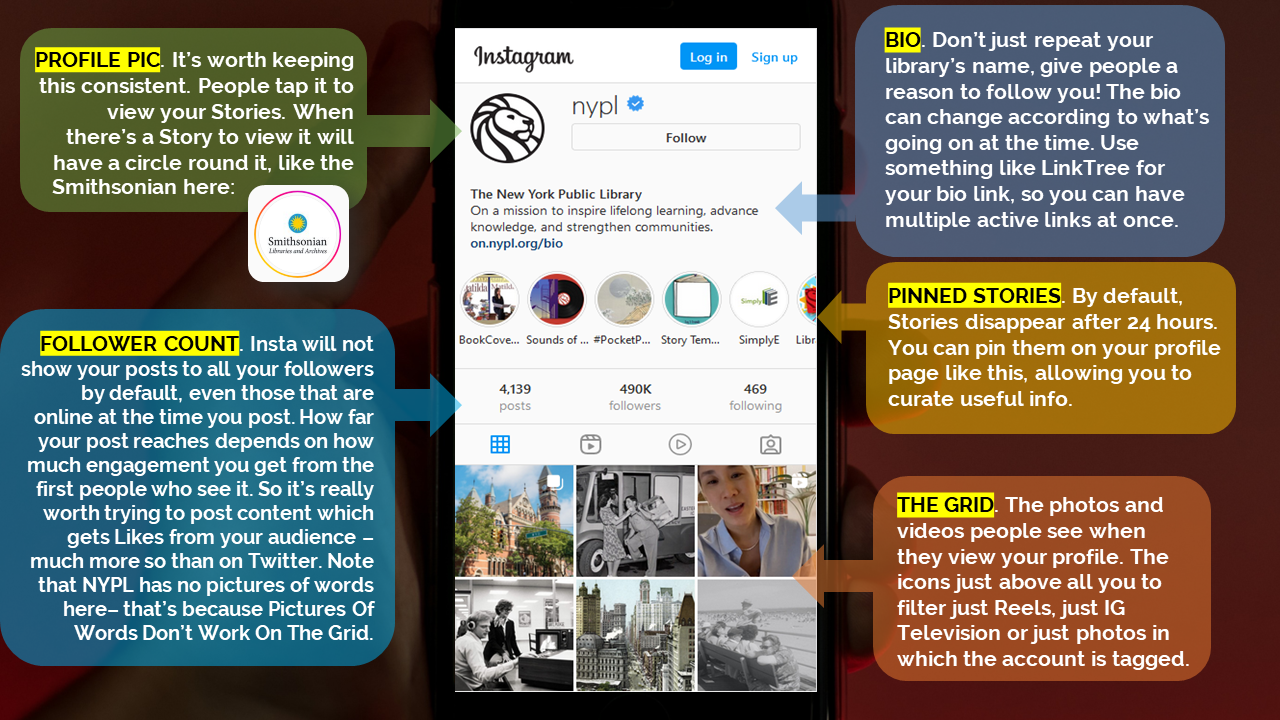
2. Set up your profile fully before engaging
Every Bluesky guide I’ve read (or written!) says this but I still see loads of accounts falling into the trap of following people before doing their profile. I get it, you’re excited to connect… But trust me you’re missing opportunities: accounts with generic avatars and no biography or introductory text are often perceived as likely to be bots, so users often don’t follow back and sometimes auto-block. Please sort your profile, and write an introductory post, before going on that following spree. It’s well worth it.
3. Get yourself into relevant Starter Packs
Getting into Starter Packs is a great way to accelerate follower growth, especially early on. It may happen on its own, but it’s best to be proactive - just ask the owners of packs to add you! That’s not some sort of breach of etiquette; speaking for myself I want to hear from you and make the packs more useful.
A very popular pack which is great to be on if possible is The MERL’s Arts & Culture pack which gets huge engagement; look locally for Packs created by parent organisations or local groups too. You can search for packs to follow and potentially to join, in the Bluesky Directory.
4. Create Starter Packs of your own that will help your community
One of the best things to ensure enough of your community is on Bluesky to make it worth your while to set up a profile, is to help that audience move from Twitter. I’ve done this in a couple of ways for my library - one is to write the Researcher’s Guide to Bluesky, which proved to be a very popular early post with over 500 reposts so far, and which I’ve got into all the relevant staff newsletters etc. The other way to create a University of York Starter Pack, so people from the institution can instantly find and connect with each other.
I’d highly recommend you do one or both of these things early on - create a Starter Pack if the need for one exists, which is helpful for your community; and if applicable write a guide for that community (e.g. ‘the healthcare professionals guide to Bluesky’ or whatever is relevant).
5. Know your target audience, and create content for them (not for other librarians!)
This is essential social media advice regardless of platform. We need to know why we are there, and who we are there for. In my case, I consider Instagram and TikTok to be fabulous ways to reach University of York Students, so I’m crafting the stuff we put on Bluesky specifically for academics and researchers. Other people may enjoy it too which is great, but I’m using the account with a specific target audience in mind - and if I find I’m getting engagement from other libraries or info pros, and NOT from the target audience, I will tweak the content I’m putting out!
6. There’s no centralised algorithm so be proactive. Follow, reply, repost and engage
Bluesky is very Twitter-like in lots of functional ways: you can post up to 300 characters at a time, you can repost, you can Like, and so on. The crucial difference is the lack of algorithm on Bluesky’s default ‘Following’ feed. There’s no endlessly auto-refreshing content, just posts from the people you follow, in reverse chronological order. That’s it. So you need to follow a bunch of people to make your feed useful, and then start getting involved: join in conversations, ask questions, repost useful things, hit the Like button. In essence - this sounds pretentious I know - the aim is to cultivate community rather than just broadcast your library news.
The details
7. Make it accessible
Finally, a platform that offers alt-text for video as well as images! Thank you Bluesky. I’d recommend accessing Settings, find the Accessibility section, and toggle the switch marked Require alt-text before posting and you can create accessible content every time. Here’s a great resource on how to write alt-text descriptions.
8. Don’t be afraid to block and otherwise moderate your experience
One of the reasons for the notable lack of toxicity on Bluesky compared with Twitter is the moderation options are extensive and they actually work. Blocking is very powerful, muting words is effective, you can detach your own post from a Repost you’re not comfortable with, and so on. Make the most of all this baked-in protection.
9. for most libraries it’s probably worth having your Direct Messages open to all
The point above about moderation notwithstanding, ideally users should be able ask you questions via a DM even if you don’t follow them. The toggle-switch you require to enable this is not in Settings, but rather in the Chat area itself.
10. The question you need to ask yourself as a social media admin is not: what should I post about my org? It’s: what is my community interested in?
Often the best way to build community online is to post a mixture of things about your organisation, and things relevant to or adjacent to your organisation. For example, this post was popular among our target audience because it was about York - there was no informational or promotional message involved, and that’s fine.
We’re back! Today in #York aesthetics news, today’s vibe is rainsoaked but sunny.
— University of York Library (@uoylibrary.bsky.social) November 25, 2024 at 10:29 AM
[image or embed]
11. Don’t be afraid to explore ideas in a bit more detail
Brevity is great but it’s not the be-all and end-all - threads work well here. As well as posting a link to our Researcher’s Guide we also explored the contents in a thread and that really helped increase engagement.
We've written a Researcher's Guide to Bluesky! It's a bit like all those other useful guides to Bluesky, but with several useful insights from University of York academics about using the platform, and we'd love it if it was reposted far and wide... >> blogs.york.ac.uk/library/2024... 🧵 below
— University of York Library (@uoylibrary.bsky.social) November 13, 2024 at 12:17 PM
[image or embed]
12. Posting first thing is probably best avoided
You often get organisations posting 8:30 - 9:30 in the morning because it’s the only time the person doing the social media has any time (and as yet Bluesky lacks an in-built scheduling tool) but in my experience so far, it’s best to wait until later in the day as more people seem to be around. At least give it until mid-morning to post anything important, if you can.
13. Images are important, despite this being a (rare) text-based platform
Don’t get me wrong, they’re not essential like they are on Insta - but if you can add context or character to a post using a picture or video, do so. Engagement will likely be higher.
I hope the above is helpful, and I also hope it doesn’t make anyone feel pressured to get onto Bluesky if they’re not ready! It seems to be staying the course as a platform and growing all the time, so if you need a few months to get permission and management buy-in and ideas together and all that stuff, it will still be here waiting for you when you’re properly ready. (And of course, if you want a bespoke workshop on it, get in touch with me…)
There are various versions of this guide aimed at different audiences. If you’re looking at Bluesky more as an individual, this blogpost on ten top tips for joining may be helpful.
I’ve already mentioned the Researcher’s Guide To Bluesky above - a leaner, more efficient and less Yorky version of this appears on the LSE Impact Blog here and lots of people have said the tips apply to more than just researchers and academics.
I may yet produce a Uni Department’s Guide to Bluesky just to complete the set, but for now do leave a comment or get in touch if you have any further advice to add, or any questions.
And finally, whilst I have some caveats when recommending Bluesky to libraries (especially if you’re not an academic library) I really have no hesitation in recommending it to librarians and anyone who works in libraries. It’s proving in some ways to be better than Twitter ever was, and I really value the community there. If you haven’t already, join us!