This post originally appeared on the Lib-Innovation blog.
This is another guest post in the Embedding Ethnography series - click to see all four so far - this time written by Oliver Ramirez. He completed some hugely detailed work for us at the start of 2016, and these are his reflections on the whole process.
Oliver is now based in London and enjoyed UX work so much he wants to pursue it further, perhaps with another internship - if you're reading this and you are potentially interested in having him come and work with you, send me an email and I'll put you in touch!
My UX research internship: More than ticking boxes
I was interested in seeing how my user experience knowledge from my Computer Science degree could apply to physical services. So, when I was offered the chance to conduct a UX research project for the library team at the University of York, I took my chance to see how library UX works.
The motivations behind the project were straightforward; among postgraduate research students (PGRs), there was a large disparity in satisfaction scores when it came to certain areas of research life. In conducting the project, I was to identify the reasons for this.
For this, the UX research approach made sense. I was to report on how PGRs conducted research, in particular their habits and reasons behind study space choices and resource choices, their interactions with others during research, and their use of study services. Through this, I would identify the pain points for less happy demographics, try to understand what worked for happier demographics, and suggest ways to try and bridge the gaps between those experiences.
As part of this research, I ran 1 on 1 sessions with PGRs across different departments. The team also gave me a couple of UX techniques to test out, so as well as a “non-directed interview”, I ran Cognitive Mapping and Love & Break Up Letter exercises with each participant.
Cognitive Mapping
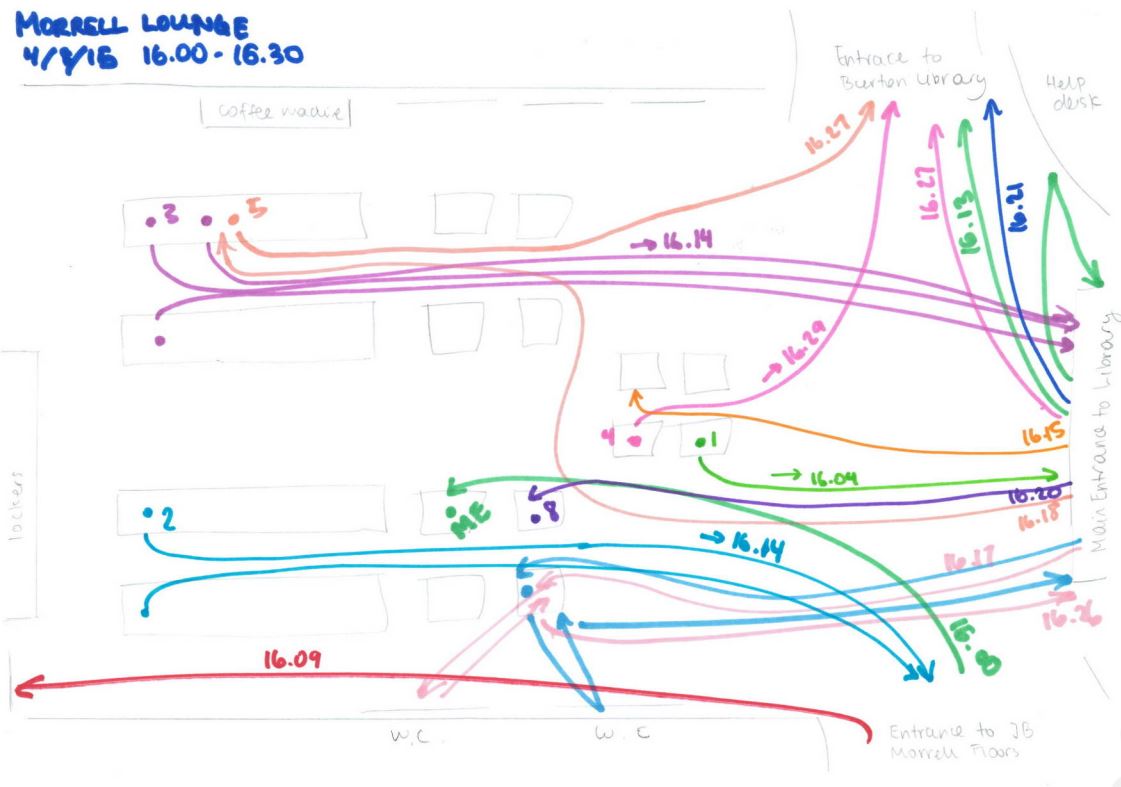
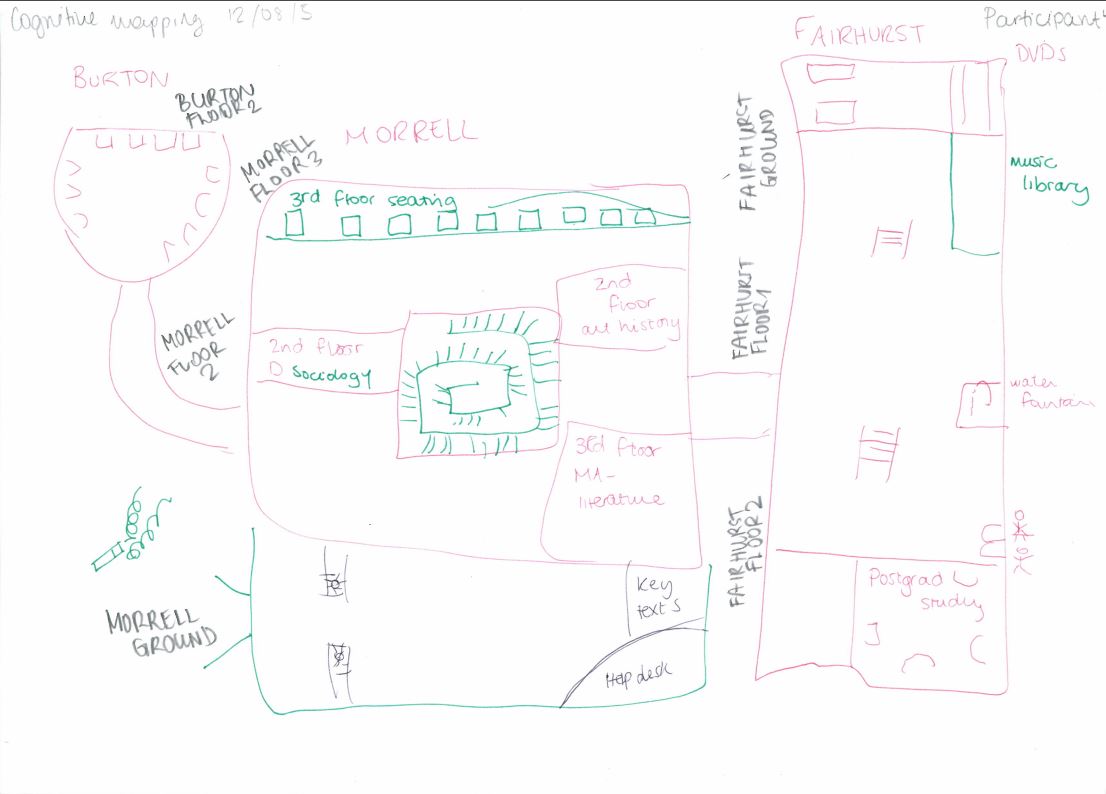
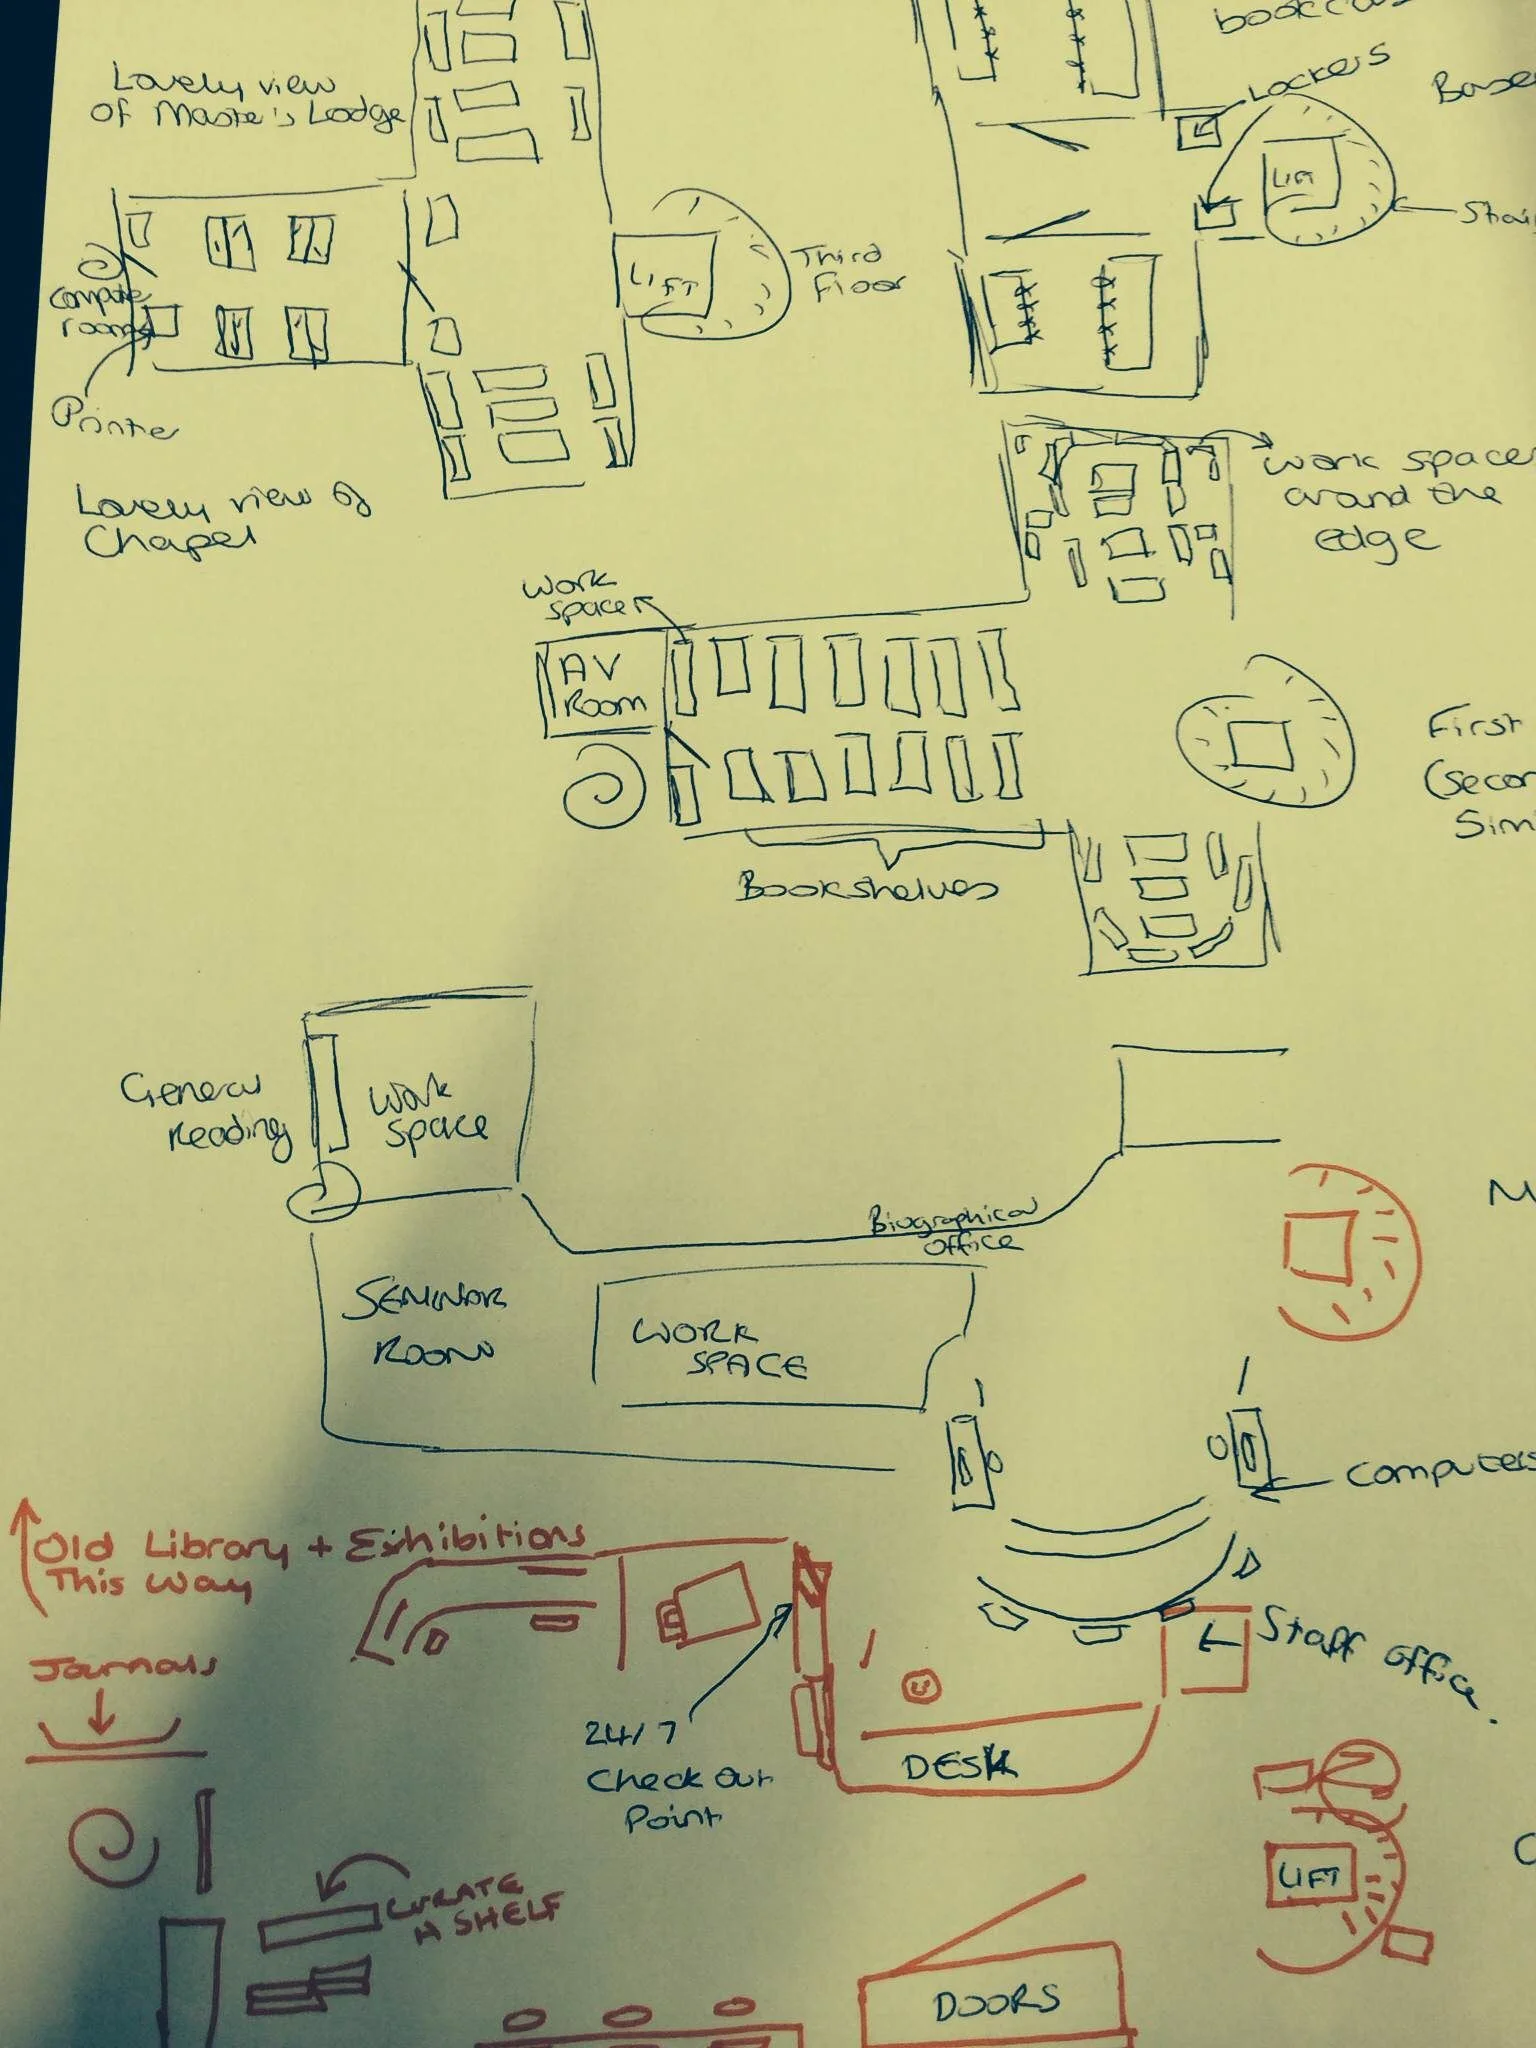
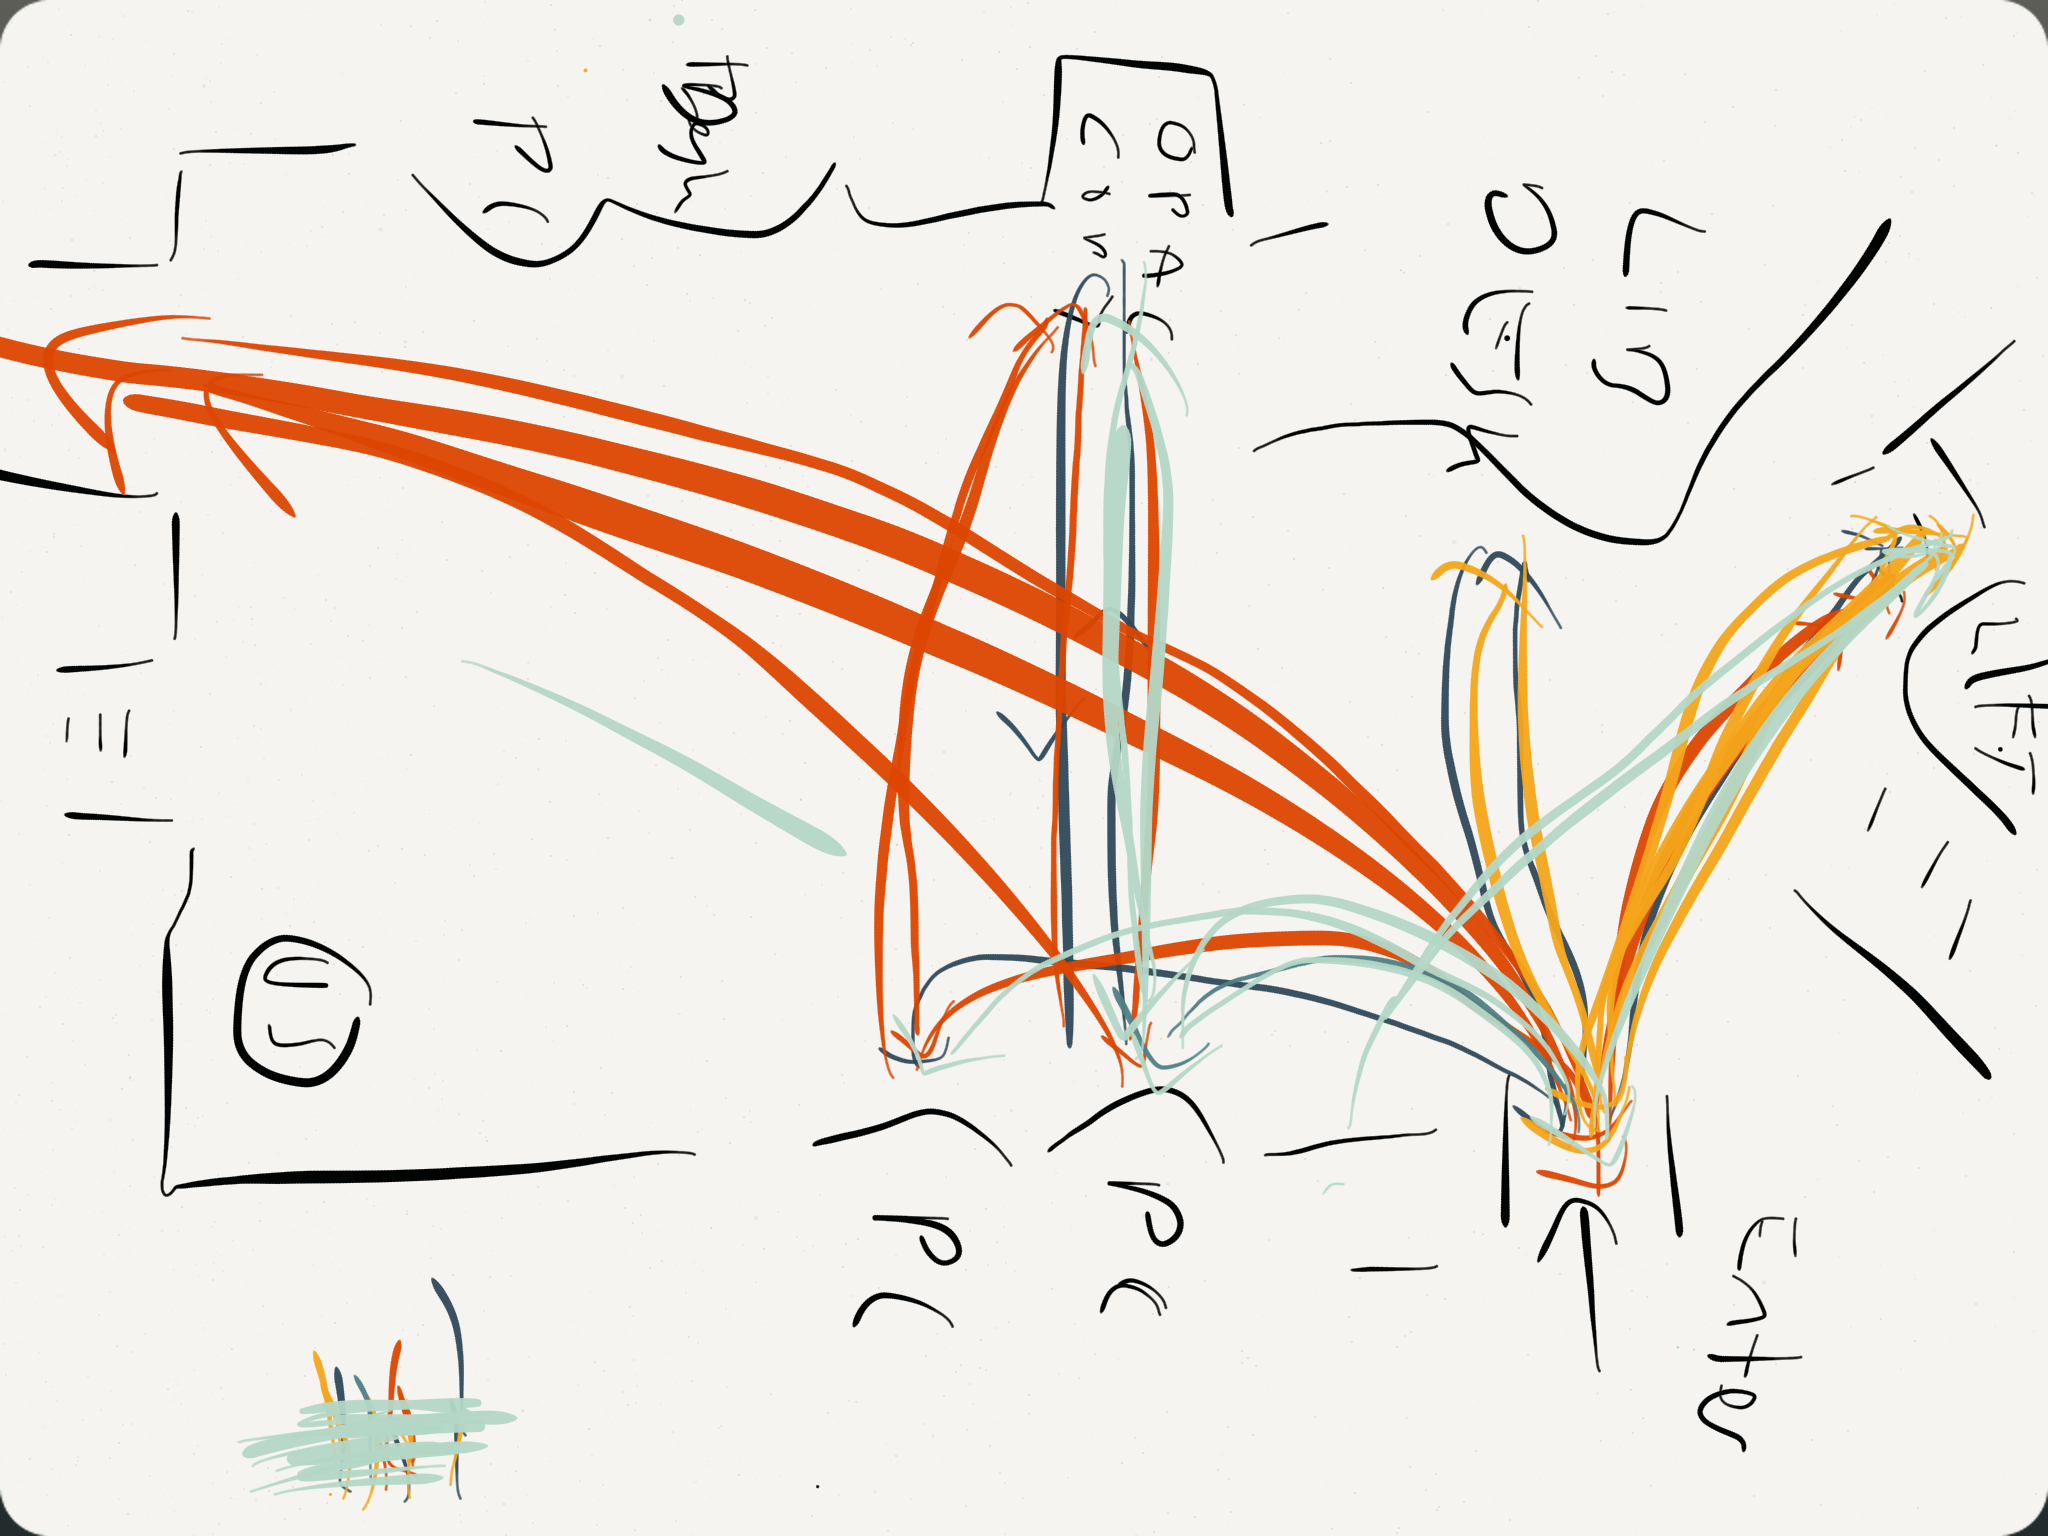
The first exercise that I ran with participants was cognitive mapping. Participants were asked to draw a “map” of the things that they interacted with while conducting research (limited to the areas I outlined earlier), mostly adopting the methodology outlined by Donna Lanclos. I say “map” because, in reality, few participants drew anything resembling a conventional map – participants mostly favoured writing down concepts (for example, ‘their office’) and linking those to other related concepts (‘their office’ may be near their ‘supervisor’).
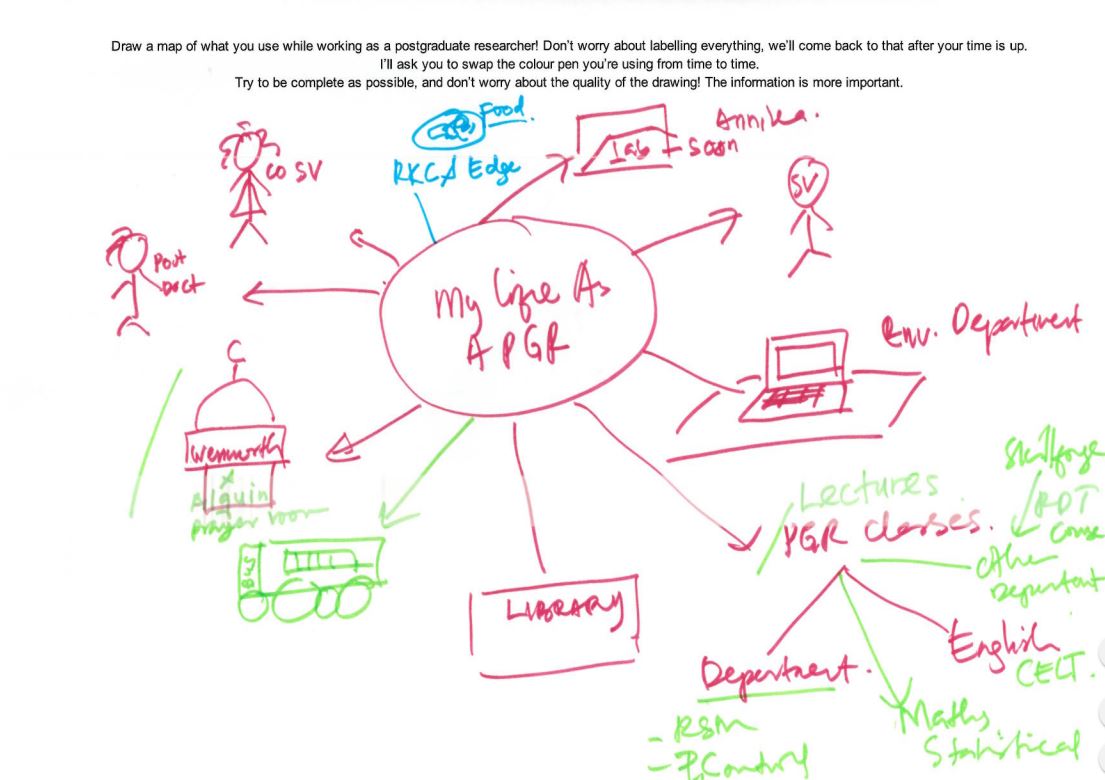
A Cognitive Map from the PGRUX Project
It was a great way of getting the participants to think about the areas I would end up interviewing them on, and the temporal and relational information captured in the map made it easier to pick up on each participant’s thoughts. One good example of this is how a participant placed importance on their desk: they drew it as their map’s central element early on, and branched everything off of that central element. This was reflected in their interview, where they emphasised the importance of that desk to them.
“Non-directed interviews”
Using the participant’s cognitive map as a ‘guide’, I would then conduct a non-directed interview. This involved taking an almost passive, neutral stance in everything I asked about, primarily allowing the concepts brought up on the participant’s map to direct the conversation – then, after those points had been exhausted, I would consult my own discussion guide to cover the rest of the areas of interest.
Conducting the interview in this way was initially difficult for me – it was sometimes hard to probe without being ‘aggressive’ (asking weighted questions or changing the topic), and I sometimes struggled to facilitate the conversation without suggesting topics to talk about.
There was immense value from conducting the session in this way, however. By focusing the interview on the topics participants brought up, gathered information more closely reflected the participant’s “perspective” – their habits, their opinions and their choices, mostly on what they were aware of in the discussed areas. Gathering the information in this way allowed for me to more effectively deliver insight on issues of awareness.
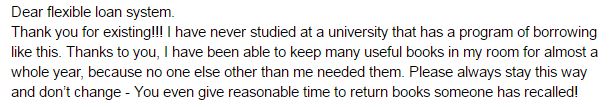
Love/Break Up Letters
Finally, participants were asked to write a ‘love’ or ‘break up’ letter. By asking participants to address this letter to a personified IT or library service, we hoped to draw out the emotions of participants towards those services, and easily establish positive/pain points.
My participants seemed to be very polarised by the exercise; people either really got into it, or they really didn’t. Upon reflection, the abstract nature of the exercise may have made some participants uncomfortable, especially knowing that their letters would be scrutinised. However, while I feel that while this technique didn’t work in a 1 on 1 session, there is merit to trying it out in a pop-up-desk context, or a ‘prize raffle’ format – this would allow for many responses, and for the easy identification of pain points across services.
All in all, I felt that the techniques allowed me to attain some real insight into PGRs, and despite the initial nerves, I really enjoyed conducting these sessions with participants. But while I’m singing the praises of these techniques now, back before I started my internship, my mentality for designing around users (or stakeholders in general) was one of appeasement – design a website that does what stakeholders need it to do, and fix any issues preventing its smooth use. A real ‘checklist’ oriented approach. Historically, I had followed this approach in my degree through a type of observation called ‘usability testing’, where I noted any issues users had when doing tasks that I had set.
So, heading into this internship, I had expected to do just that: more observation, make a list of issues to fix, and suggest some solutions - tick those boxes off, one by one, on the way to a “good UX”. But, throughout my internship, I realised this approach just yields a ‘passable’ user experience – you end up with something that works, but not necessarily something that’s good.
Example of Findings: Lonely Researchers
For example, one of my participants told me something that really struck me: they said that when they were based at a general desk, that they felt disconnected from their department. It was always possible to contact or visit their supervisors, or use the department testing rooms, or go out of their way to interact with their peers, but not being based alongside all of that meant that they felt ‘distant’ with their department. This changed when they were offered a desk inside their department. Besides improvements on all of those fronts, they reported feeling ‘valued’ as a member of the university because of it.
The importance of ‘department community’ - being alongside your researcher peers and supervisor so that interaction is readily possible – was prominent in my discussion with some participants. During my research, I found that while non-department PGR study spaces covered various noise levels (something participants valued), those spaces did not facilitate this kind of ‘natural interaction’ that only happens when PGRs and supervisors are all based together – and so PGRs based outside their department missed out on this.
My approach of “observation to find issues, fix issues” would not have yielded this type of insight – I would have thought along the lines of “they don’t really like the silence in this building”, suggested to change the noise level policy and called it a day. It wouldn’t have made much headway in creating a better UX for the people based outside their departments.
But, it finally dawned on me during my time with the library team at York: good UX necessitates understanding what your user values, what is important to them, and actively working with that in mind. Which worked out for me, in the end: UX is a more satisfying when it isn’t just making something that works and ticking boxes.
Header pic of the University by Paul Shields, used by permission.