
UPDATE: June 2016.
I wrote the post below in August 2015 - I was very excited about the stats showing that, despite the overall decline, the sheer number of library visits compared very well with lots of other activities people in the UK take part in. I used a hyperbolic headline ("Visiting libraries is the most popular activity in the UK") which was designed for maximum impact, but was, in the way of headlines, lacking in nuance. It seems naive, looking back at it, and I flinch a little every time someone tweets it now, nearly a year later.
Part of the reason for this is a that the stats are a snapshot of that time - all the sources of figures, listed in towards the bottom of the post, were the most recent available at the time of writing. Most will have changed since then - including the main library use stat, which was for the 2013-14 financial year. CIPFA posted more up to date figures in December 2015.
So the principle of this I still stand by - comparing library use with other activities is a good way to reframe the story of decline in use. But OBVIOUSLY to be used in any kind of serious way in 2016 and going forward, up to date figures would be required. Also, you'll see below I wrote very specifically: "...no need to attribute anything (except the original data sources)."
The Society of Chief Librarians are using the figures below in some posters they brought out at the recent SCL Horizons event. They chosen not to comply with the my wish above that the original data sources be attributed and they've wilfully ignored the most recent CIPFA figures so have knowingly promoted misleading figures on the grounds that 'the stats would stand for next year'. (What? They're stats for a specifc year. They stand for that year only.)
I feel partially responsible for this because I wanted this stuff to be used and I was delighted so many people shared it when it first came out. I made it CC-0 precisely because I wanted people to take it and run with it (and because I don't 'own' the collation of a series of statistics anyhow). But I feel like the SCL were pretty remiss to reproduce this stuff for their big event (apparently there is great demand for the poster) in 2016 without acknowledging that the figures are for a specific period of time. They've said that the banner was a one off and that the poster version will be corrected and updated - I very much hope this is indeed the case.
I'm always struck by just how many people use libraries in the UK. It's a mind-bogglingly huge amount.
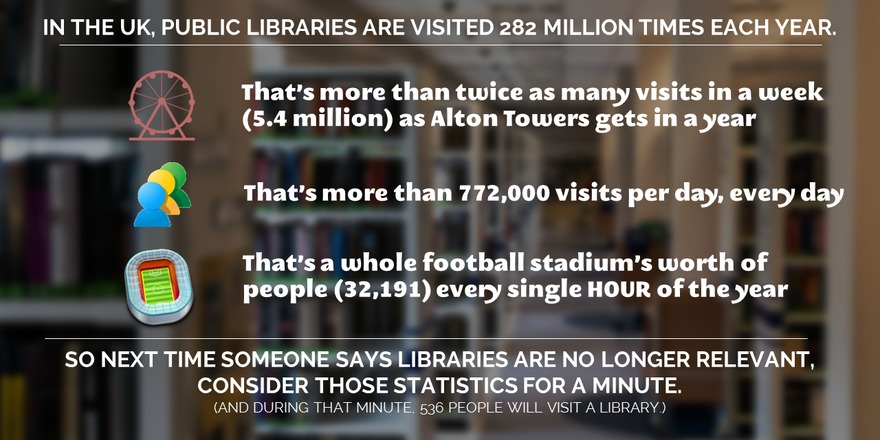
When we hear about the figures they're always couched in terms of reductions - CIPFA tells us about the continuing decline, noting that UK visits to public libraries in 2013-14 fell to 282 million, from 288 million the previous year. I'm not surprised it fell - we lost 49 branches and 1,000 full-time-equivalent staff in the same period.
But why do we never take the figures in isolation? 282 million visits! That's MASSIVE. And then I started wondering how that compared with other things we visit in the UK. I came up with a list of as many as I could think of, and guess what? We visit libraries more than we visit ANYTHING else. In fact, we visit libraries twice as often as we visit football matches, theatres, A&E and the Church combined.
I mean come on!
So inspired by some utter drivel from the Telegraph about a new Government initiative about libraries (more on which another time), I've come up with some different ways of expressing the comparisons between how often we visit libraries versus other things we visit.
Everything below has no licence attached to it so please use it however you wish - tweet it, blog it, embed it, remix it, change it, and no need to attribute anything (except the original data sources). I just want this message to go as far and wide as possible.
Library usage stats broken down into smaller timeframes
I'd be really keen for people to make their own versions of these - I'm sure we can do better than what I've come up with below. This is the perfect size to tweet as it won't need expanding to be viewed on Twitter.
I really like this version from @bookmarkpeople, too:
Here are all the subdivisions if anyone's feeling creative with comparisons:
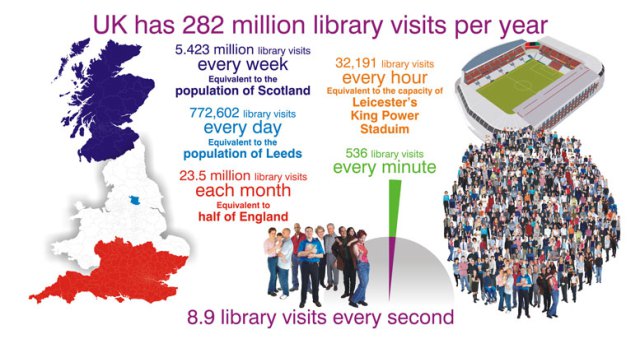
- 282 million library visits per year
- 23.5 million library visits each month
- 5.423 million library visits per week
- 772,602 library visits per day
- 32,191 library visits per hour
- 536 library visits per minute
- 8.9 library visits per second. For every second! Of the entire year! I mean seriously, how the hell can people claim we don't need libraries any more?
Library usage stats on Sway
Here's the first version of the stats. It's done using Sway, a new tool from Microsoft. Direct link to the presentation here.
Clicking the button above will allow you to tweet a link to that Sway presentation. I also did a vertical scrolling Sway in a slightly different style - take your pick! Both Sways allow duplication, so if you want to take them as a starting point to make your own version, feel free - improve and enhance it.
Library usage stats on Slideshare
A slightly different approach for this one - a teaser format where the most popular activity isn't revealed until the very end. Here's a link direct to the slides.
The slides were Featured on Slideshare's homepage and also tweeted by the CEO of the Arts Council, so hopefully we're getting beyond the echo-chamber!
Library usage stats on video
Here's a YouTube video - the same statistics as in the slides, but this time made in PowToon.

Library usage stats: the raw figures
Here are all the raw figures I collected - if you take these and do something interesting with them, let me know in a comment and I'll add whatever it is to this list!
230 million library visits in England (282 million in UK): http://www.cipfa.org/about-cipfa/press-office/archived-press-releases/2014-press-releases/cipfa-library-survey
Cinemas: 165.5 million admissions: http://www.cinemauk.org.uk/facts-and-figures/admissions/uk-cinema-admissions-2013-by-region/
Church of England: 52 million visits: https://www.churchofengland.org/about-us/facts-stats/research-statistics/parish-attendance-affiliation.aspx
The UK itself: 32.8 million visits from overseas in 2013: http://www.ons.gov.uk/ons/rel/ott/travel-trends/2013/rpt-travel-trends--2013.html
Theatre: 22 million attendees in 2013: http://www.telegraph.co.uk/culture/theatre/11001177/Almost-twice-as-many-people-visit-the-theatre-than-attend-Premier-League-games.html
Hospital A&E Departments: 18.5 million visits http://www.hscic.gov.uk/catalogue/PUB16728
Premier League Football: 13.9 million total attendance http://www.espnfc.com/barclays-premier-league/23/statistics/performance?season=2013
There used to be Museums and Galleries figures here, but they turned out to be just for DCMS owned insitutions so I've removed them - thanks to Ian Clark for the heads-up.
Library usage stats: as a Google doc
And finally, if you want to do stuff with the data it may be useful to have it in a spreadsheet: here's a Google doc. It's set to 'anyone can view' - if you want to edit or add to the data etc just make your own copy.
What other people are doing with the stats
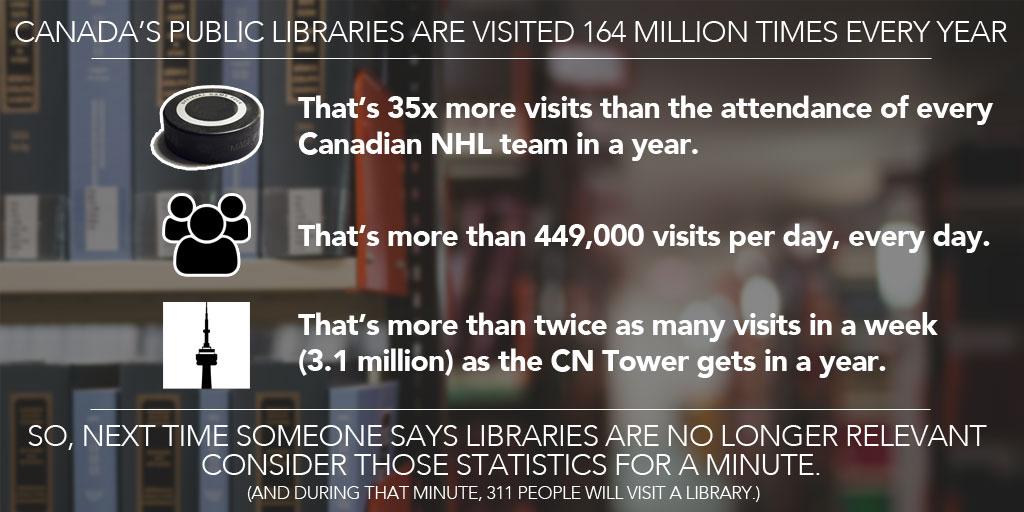
The first remix has arrived! Really pleased that Adlib has redone the graphic at the top of this page but for Canadian libraries.
I hope others will be encouraged to take this basic idea and run with it - either by finding new ways to express the information, or finding new information, or redoing some of these resources for different parts of the world...
Spread these messages however you want, as far as you can. And keep the statistics to hand - every time someone says 'we don't need libraries in the digital age' we can respond 'actually 772,000 people in the UK will need them today alone!' and all the rest of it.
Let's do this!