Ethnography at York

UX-led changes at York and beyond

Reblogged from Lib-Innovation

As anyone who has embarked upon User Experience work will have learned, ethnography is actually the easy part. For all its messy, complicated, time-consuming complexity, getting the go-ahead for fieldwork and undertaking it is relatively straightforward compared to designing (and getting approval to put into place) changes to our services. It is vital to have a cut off point where we as UX practitioners stop collecting data, bite the bullet, and move on to phase 2 of the process. After all, it's the design and service tweaks that make this UX - otherwise all we're really doing is ethnography.

I think it's really important to a) push as many small tweaks through as possible, and then learn from them and assess their impact, and b) make details of the changes publicly available so others can get not just inspiration but a use-case to push through their own change.

So - what have institutions been doing as a result of what they've learned from ethnography? I have several examples from the University of York and some from further afield too.

I thought it might be useful to group the examples of UX-led improvements into categories. In all these instances ethnographic fieldwork has either instigated the change or supported the change - it's interesting that often UX can be the trigger to get something done which library staff and users have been considering and / or suggesting for a while. Often the fieldwork is one source of feedback alongside a couple of others in the examples below, which combined to be a strong enough argument to make a change.

Catalogue improvements

At York we've made several small changes to Yorsearch, the (Primo-based) library catalogue, in addition to the full user-interface change which will arrive shortly.

  • The classmark for books now appear in the search results screen, rather than the user needing to click on a title to reveal its location. It's only a small change but we get around 25,000 views a day for Yorsearch - that's a lot of people now having to make one less click to get what they need. This particular change came from our first UX project with Postgrads, along with work from the Discoverability Group, and from seeing that that Imperial had successfully achieved the same thing with their Primo interface already, following their own UX work...
     
  • Talking of Imperial, they've made the full report of their 2016 UX work available for anyone to download [*applauds*] - have a read, it's fascinating and useful material.
     
  • We changed the terminology in the catalogue on the buttons you press to access books and ebooks - from Get It and View It, to Find in Library and View Online. Again this came out of several sources of feedback, including the Discoverability Group, and front-desk staff reporting that users simply didn't seem to get it when it came to View It and Get It.

Library space and environment improvements

  • We made a hot-water tap available 24/7. Our UX work revealed that particularly in winter  students from Asia like to drink hot water in the way that in the West a lot us like to drink chilled water; this gave more context to previous requests for a hot drinking water tap. One has now been installed alongside the chilled water fountain.
     
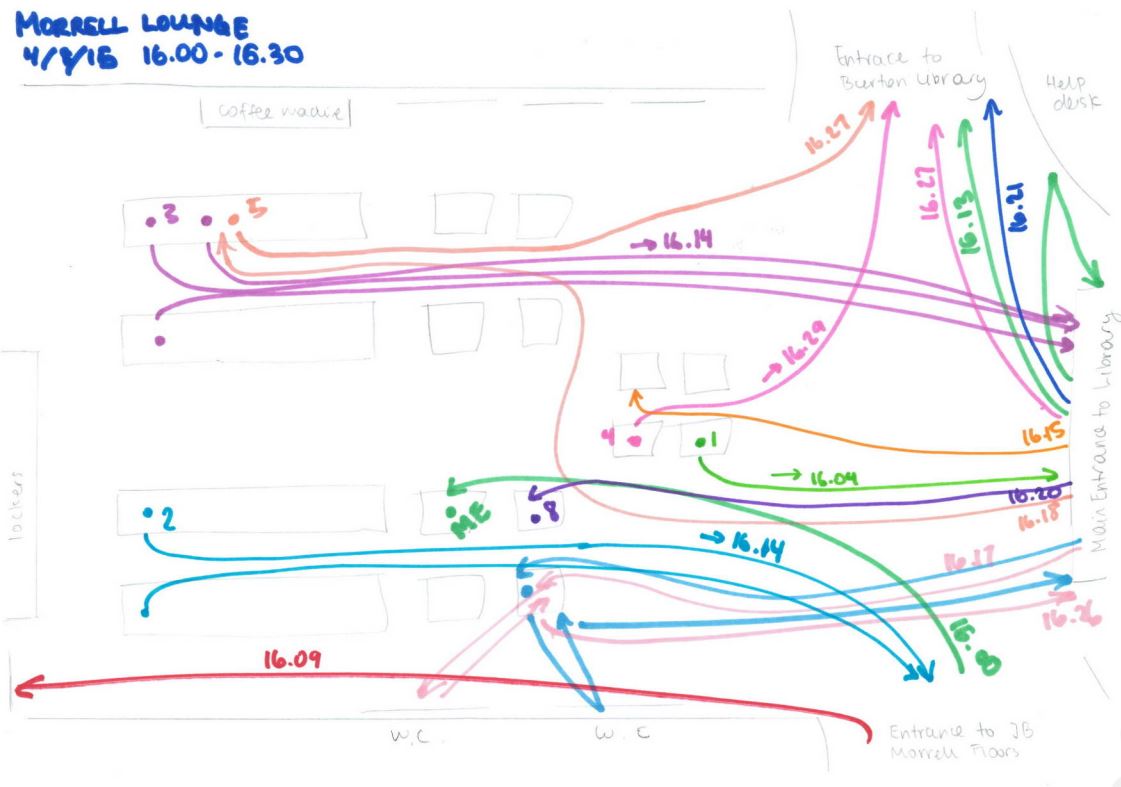
  • We made the Burton Library accessible 24hrs a day. Our library is open 24 hours, but previously only the main Morrell Building (the one with the books) and the Fairhurst (lots of study space) stayed open all the time; the silent reading room in the Burton closed at 10pm. Our UX work constantly demonstrated that the Burton was not as highly valued as we imagined it was - for example several students left it out of their congnitive map of the building, almost no students included it in their touchstone tours, and in our behavioural mapping we even observed students wandering up to the entrance, peering in to the stairwell that led up to the reading room, then just turning around and coming back, apparently not feeling like they wanted to cross the threshold. As part of the UX unstructured interviews we discovered that even some students who knew about the Burton didn't like using it because even if they had no intention of working past 10pm, they loathed the idea of setting up all their work and devices etc and then having to move them to another building at 10pm if they were still there at that time after all.

    So we upped our promotion of the Burton, it had a very nice re-design (although that wasn't directly related to anything we'd done with UX, it was happening anyway) and we made it accessible 24 hours a day. We're now monitoring the space as part of a new UX Project and the initial impressions are that it's already busier.
     
  • We've given the students blankets. A pile of blankets in a basket near the entrance - people can help themselves and deposit the blankets back there when they leave. I cannot tell you how popular this has been... There are examples of effusive tweets and feedback on our graffiti wall in the presentation below - it's so nice to do something simple but effective! Temperature is always a problem in libraries, and there's often a more or less even split between people who are too hot and too cold. My History of Art students came to me to say they found working in King's Manor (our City-centre site which is nearly 500 years old so not overly warm) really hard when it was so cold. So we managed to get Estates to get some more heaters, and we bought blankets - this idea came from some UX work undertaken at Cambridge in 2015. We also bought blankets for our main library and the Minster library too. 

    (Top tip: buy really drab and unexciting looking blankets. They keep people just as warm but are much less likely to go missing...)
     
  • Thanks to Ingela Wahlgren and Andy Priestner who gave me examples of their (current or former) institutions having changed the locations of digital screens as a result of behavioural mapping, in order to put the screens somewhere people will actually look at them. This could be displaying key info in areas where people have to queue, or it could be as simple as putting them in the direct line of site as students move forward through a space, rather than off to the side in people's peripheral vision.
     
  • Sometimes students describe an area as noisy even though it's ostensibly a silent study zone. Truly observing the space can often solve the mystery of why this is happening - Jenny Foster gave me an example of her institution realising the beep of the self-issue machine could be heard four floors up! So they found the volume and turned it down. At Cambridge they discovered there were loud hinges on office doors so they oiled them...
     
  • Like with the noise examples above, small changes really do add up. Carl Barrow told me some of the changes his HEI had made based on their fieldwork: additional signage (both analogue and digital), more printers, phone charge stations (why aren't we all doing these?) and a new coffee cart. Together all those minor tweaks will have a significant impact on the user experience, which is the name of the game after all.
     
  • UPDATE: At the #NCLXUX event I've just heard Carl say they also re-positioned digital screens, having noticed no one looked at most of them. One, which was positioned in the entrance as people came through the turnstiles, DID get looked at - so they used that exclusively to promote the Skills Team's workshops, and as a result saw a much bigger uptake for those sessions... I love this - a great example of the impact UX can have in unexpected ways...

Library service improvements 

  • At York we've moved academic staff onto our part-time package for borrowing books, giving them a little longer to return items without impacting too heavily on the rate of circulation overall
     
  • We've changed the way we run our annual review of subscriptions to allow for more time and stop it clashing with other key things in the academic calendar
     
  • We've changed the way we communicate key information to academics
     
  • We've used academics' detailed views on our current reading list system to inform the choosing and customisation of the new one
     
  • At Cambridge the FutureLib developed a whole app for finding study space

UX and Impact

I'm excited to hear a load more examples of UX-led change at UXLibs III (the third annual User Experience in Libraries Conference). The paper submissions we've had this year are fantastic, and the emphasis of the conference this year is on the impact of UX.

Finally, here are the slides from my Wales talk which mention a lot of the examples above, along with some next steps if you want to try ethnography at your own institution, and introductions to ethnography and design:

UX, ethnography and possibilities: for Libraries, Museums and Archives


I spoke about UX last week at a Welsh Government event in Aberystwyth, the annual Marketing Awards for the Library, Archive and Museum sector. It was a rare chance to talk to an audience not just of information professionals, and I had a great time. I'm really hoping some of the User Experience in Libraries movement now spills over into museums and archives too...

My presentation consisted of an introduction to UX, examples of 7 ethnographic techniques, a brief section of user centred design, and then several instances of UX-led changes - things people have done to tweak or change their services, based on ethnographic fieldwork. For this part thanks to Andy Priestner, Jenny Foster, Ingela Wahlgren and Carl Barrow for their examples, and it also has in it a bunch of things we've done at my own place of work. The final section consists of some next steps, for those wishing to dip a toe in the UX waters at their own institution.

I had several interesting conversations after my talk, with some people who were already doing UX (we agreed it can really energise the workplace) and some people who wanted to try it out. Two completely independent and unrelated chats with people from the museum sector were about using UX with people in difficult situations - one was around early onset dementia, and the other was about returning to work after periods of incarceration. I don't know if ethnography is already used in these settings but it sounded potentially fascinating, and an angle to this work I'd never considered.

There was also an absolutely brilliant presentation from Mari Stevens, who is Director of Marketing - Tourism and Business, at the Welsh Government (having started off in the library sector). Her slides were ace and she was a hugely impressive speaker. The scope and scale and ambition of her marketing plans for the country I found absolutely inspiring. The presentation was half in English and half in Welsh with live translation into ear pieces for those like me who needed them - the translator did a pretty amazing job too.

It was great to see the National Library of Wales, which towers over the town like, as Penny Andrews put it, a massive BOOK FORTRESS.

Huge thanks to Jane Purdie for inviting me to Wales (we've been trying to sort this out since 2015 so it was lovely to finally make it happen) and to everyone at the event for being so welcoming and asking insightful questions, and for giving me lots of ideas for good marketing practice to take away with me... And if you DO start doing UX at your institution, please get in touch to let me know how it goes!

5 stages to processing and acting on 100+ hours of ethnographic study

This post is reblogged from the Lib-Innovation blog, to tie up and follow on from the previous post on THIS blog about the Understanding Academics Project.

Understanding Academics, introduced in the last blog post, is far and away the biggest UX project we’ve attempted at York, and the processing and analysis of the data has been very different to our previous ethnographic studies. This is due to a number of factors: primarily the sheer size of the study (over 100 hours’ worth of interviews), the subject matter (in depth and open ended conversations with academics with far ranging implications for our library services), and actually the results themselves (we suspected they’d be interesting, but initial analysis showed they were SO insightful we needed to absolutely make the most of the opportunity).  

Whereas for example the first UX project we ran conformed almost exactly to the expected 4:1 ratio of processing to study – in other words for every 1 hour of ethnography it took four hours to analyse and process – the total time spent on Understanding Academics will comfortably be in excess of 400 hours, and in fact has probably exceeded that already. 

UX is an umbrella term which has come to mean a multi-stage process – first the ethnography to understand the users, then the design to change how the library works based on what you learned. In order to ensure we don’t drown in the ethnographic data from this project and never get as far as turning it into ‘proper’ UX with recommendations and changes, Michelle Blake and Vanya Gallimore came up with a 5 stage method of delivering the project. 

Two particular aspects of this I think are really useful, and not things we’ve done in our two previous UX projects: one is assigning themes to specific teams or individuals to create recommendations from, and the other is producing and publicising recommendations as soon as possible rather than waiting until the end of the whole project. 

As you can imagine the 5 stage method is very detailed but here’s a summary:

Coloured pens used in cognitive mapping (in this case with the interviewer's reminder about the order in which to use them)

Coloured pens used in cognitive mapping (in this case with the interviewer's reminder about the order in which to use them)

      1)  Conduct and write up the ethnography. Academic Liaison Librarians (ALLs) spoke to around 4 academics from each of ‘their’ Departments, usually asking the subject to draw a cognitive map relating to their working practice, 
and then conducting a semi-structured interview based on the results. 

The ALLs then wrote up their notes from the interviews, if necessary referring to the audio (all interviews were recorded) to transcribe sections where the notes written during the process didn’t adequately capture what was said. The interviews happened over a 2 month period, with a further month to complete the writing up. 

      2)   Initial coding and analysis. A member of the Teaching and Learning Team (also based in the library) who has a PhD and experience of large research projects then conducted initial analysis of the entire body of 100+ interviews, using NVIVO software. The idea here was to look for trends and themes within the interviews. The theming was done based on the data, rather than pre-existing categories – a template was refined based on an initial body of analysis. In the end, 23 over-arching themes emerged – for example Teaching, Digital Tools and Social Media Use, Collaborations, Research, Working Spaces. This process took around 2 months. 

      3)   Assigning of themes for further analysis and recommendations. Vanya then took all of the themes and assigned them (and their related data) to members of the Relationship Management Team – this consists of the Academic Liaison and Teaching and Learning teams already mentioned, and the Research Support team. This is the stage we are at now with the project – each of us in the team have been assigned one or more theme and will be doing further analysis at various times over the next 8 to 10 months based on our other commitments. A Gantt chart has been produced of who is analysing what, and when. The preparation and assigning of themes took around 2 weeks.

      4)   Outcomes and recommendations. There are three primary aims here. To come up with a set of practical recommendations for each of the themes of the project, which are then taken forward and implemented across the library. To come up with an evidence-base synthesis of what it means to be an academic at the University of York: a summary of how academics go about research and teaching, and what their key motivations, frustrations and aspirations are. (From this we’ll also aim to create personas to help articulate life for academics at York.) And finally to provide Information Services staff with access to data and comments on several areas in order to help inform their work – for example members of the Research Support team will have access to wealth of views on how academics think about Open Access or the repository. 

These aims will be achieved with a combination of devolved analysis assigned to different groups, and top-down analysis of the everything by one individual. Due to other projects happening with the teams involved, this stage will take up to 7 months, although results will emerge sooner than that, which leads us neatly to...

      5)  Distribution and Dissemination. Although this is last on the list, we’re aiming to do it as swiftly as possible and where appropriate we’ll publicise results before the end of the project, so stages 4 and 5 will run simultaneously at times. The total duration from the first interview to the final report will be around 18 months, but we don’t want to wait that long to start making changes and to start telling people what we’ve learned. So, once an evidence-based recommendation has been fully realised, we’ll attempt to design the change and make it happen, and tell people what we’re doing - and in fact the hope is to have a lot of this work completed by Christmas (half a year or so before the Summer 2017 intended end date for the final report). 

The full methods of dissemination are yet to decided, because it’s such a massive project and has (at a minimum) three interested audiences: York’s academic community, the rest of Information Services here, and the UX Community in Libraries more widely. We know there will be a final report of some sort, but are trying to ensure people aren’t left wading through a giant tome in order to learn about what we’ve changed. We do know that we want to use face to face briefings where possible (for example to the central University Learning and Teaching Forum), and that we’ll feedback to the 100 or so academics involved in the study before we feedback to the community more widely. 

Above all, Understanding Academics has been one of the most exciting and insightful projects any of us have ever attempted in a library context. 

Embedding Ethnography Part 5: Understanding Academics with UX


This is the 5th post in a series about using UX and ethnography as regular tools at the University of York. We're treating these techniques as 'business as usual' - in other words part of a selection of tools we'd call upon regularly in appropriate situations, rather than a stand-alone or siloed special project. If you're interested you can read Part 1: Long term UX, and two guest posts from our UX Interns in Part 2 and Part 4, plus my take on planning and delivering a UX-led project in Part 3.

Having focused our first two uses of UX on students - specifically postgraduates - the third time we've used it in earnest has been with the academic community.

One of the consent forms from the project

One of the consent forms from the project

The Understanding Academics Project

The project to better understand the lives and needs of our academics was an existing one in the Library: we knew we wanted to tweak our services to suit them better.  After finding the UX techniques so useful we decided to apply them here and make them the driving force behind the project. All other useful sources of info have been considered too - for example feedback to Academic Liaison Librarians, comments from the LibQual+ survey etc - but the body of the project would involve using ethnography to increase our understanding.

We've used five main ethnographic techniques at York (six if you count the feedback wall we now have near the exit of the library) but decided to limit ourselves to two of them for this project: cognitive maps, and semi-structured interviews. We aimed to meet 4 academics per Department, and ask them to draw a cognitive map of either their research process or the process for designing a new module - so unlike our previous UX projects which involved maps of physical spaces, this was literally 'mapping' the way they worked. Some interpreted this very visually, others in a more straightforward textual way. In all cases though, it proved an absolutely fascinating insight in to how things really work in academia, and provided a brilliant jumping off point for the interviews themselves.

These interviews were semi-structured rather than structured or unstructured; in other words they were based largely on the map and a natural flow of conversation rather than having any pre-set questions, but there were areas which we'd bring up at the end of they didn't come in the conversation without prompting. So for example most people in drawing the teaching-related map mentioned our reading list system, either in the map or in conversation - if after 50 minutes of chat it hadn't come up at all, we'd ask as open a question as possible to prompt some insight into their thoughts on it.

Vanya Gallimore has written a great overview of the project on the Lib-Innovation Blog, which we set up in the library to document our UX work among other things. In it she writes about the background to the project, the methods used, staffing it (in other words, who was doing the interviews) and then briefly about processing the data. It's the most popular post on our new blog and I'd recommend giving it a read.

For now I want to focus on something that post doesn't cover so much: actually doing the ethnography.

Ethnography fieldwork in practice

What is the verb for ethnography? Is it just 'doing' ethnography, or performing ethnography? Ehtnographising? Whatever it is, I hadn't done it in earnest until this project. In the two previous projects I'd been involved in setting things up, helping with the direction, interpreting the data and few other things, but we'd had interns out in the field, talking to people and asking them to draw maps etc. For Understanding Academics, it was agreed that the Academic Liaison Librarians (of which I am one) should be doing the fieldwork, for various reasons described by Vanya in her post linked above - ultimately it came down to two things: the need for a proper familiarity of the HE context and our systems in the Library in order to understand everything the academics were saying; and the sheer opportunity of talking in amazing depth with people in our departments.

One of the most common quesitons about the project is: how did you get the academics to take part? The answer is, we asked them all individually, by email. No mass emails to the whole department, but no incentives either (we've offered post-graduates cake vouchers and the like, in previous UX projects) - just an email to a person selected with care, often in conjunction with the Library Rep and / or Head of Department, explaining what we were doing, why we were doing it, and our reasons for approaching them specifically. We asked around 110 academics this way, and 97 said yes: the other 13 either didn't want to do it or couldn't make time within the duration of the project.

There was a roughly even split of research focused and teaching focused conversations (although in either case there were no limits to the conversation, so some interviews ended up mentioning both). I look after three Departments from the Library: I interviewed three academics from one, and four from each of the other two, plus I did two of the three 'warm-up' interviews.

Prep

The warm up interviews were just like the regular interviews, and their data included in the project, but they were with partners of library staff who happened to be academics... The idea was to refine our processes and see how things worked in practice, on an audience who wouldn't mind being subject to our first attempts at ethnographic fieldwork. This was really useful, and we changed things as a result - for example the message written on the top of the piece of paper assigned to draw cognitive maps on was made clearer, and we extended the time we'd set aside for each interview after the try-outs used their 60 minute slots before the conversations had reached a natural conclusion. 

For the remainder of my interviews the prep consisted of reading up on each academic on their staff profile page, printing out the various bits of paper required, and charging devices. 

Accoutrements

There were a lot of things we had to bring with us to each interview.

  • a device to audio-record the whole thing on (my phone);
  • a device to write on (ipad with keyboard, or laptop); 
  • the paper with the map explanation on; 
  • the paper with the areas to cover if they didn't arise naturally listed; 
  • two copies of the consent form - one for us to keep and one for the subject to keep
  • a set of four pens (we ask users to draw cognitive maps over a period of 6 minutes, giving them a different colour of pen every 2 minutes)

Of the above, the cognitive map, conversation topics and consent forms were all either teaching specific or research specific - largely the same but with subtly different wording in places. 

The Map

Each session began with an explanation of what we were doing here. The emails sent to invite each academic had covered some of that, but it's always good to talk it over. We discussed what the library wanted to do (change things for the better) but that we didn't have specific things in mind - we wanted to be led by the data. Then we talked about the format of the interview, the fact it would be recorded, and went through the consent forms. I particularly stressed the fact they could withdraw at any time - in other words, an academic could decide now, several months later, that they wished they hadn't been so candid, and we'd take all their data out of the study.

Finally we explained the map, the use of the different colours of pen, the fact it didn't have to be remotely artistic. None of my interviewees seemed particularly put off or phased by drawing the map. Then there was a period of silence as they drew the map (not everyone needed all six minutes; if people took longer than six minutes I didn't hurry them), after which I turned on the recorder and said 'Now if you can talk me through what you've drawn...' 

The Interview

Once the subject had described their map - with me trying not to interrupt unless I didn't understand something, but jotting down potential questions as they talked - the interview commenced. I can't recommend highly enough using either a cognitive map or another ethnographic technique such as a love/break-up letter or touchstone tour as a jumping off point for an interview. It means you instantly have context, you're in their world, and there's no shortage of meaningful ideas to talk about. 

I have to say that during the main body of the interview, I didn't actively try and think about what the project was trying to achieve, I just asked questions I was interested in. Sometimes this meant spending a long time discussing things which weren't library related at all - but that's part of what this project is all about, to understand the academic world more holistically rather than in a library-centric way. 

Some interviews came to a natural end after around 40 minutes; others I felt like we could have gone much longer but I didn't want to take up more of their time than I said I would.

Writing up

One of the changes we made after the initial interviews was to just listen and not try and write notes whilst the protagonists described their map. We didn't have time to transcribe each interview (that would mean we'd have spent more than 500 hours on the project before a single piece of analysis) but we did feel the map description was key, so we listened without writing during that bit and transcribed it fully later. We then wrote notes as we conducted the interview, using the recording to go back and fill any holes or make clear anything from our notes that didn't make sense. Sometimes during a particularly long and involved answer I'd just write go back and listen to this in my notes and stop writing until the next question. 

We blocked out time after each interview to write it up immediately while it was fresh in our minds - so in my case this was mainly going through and correcting all the mistakes from my high-speed typing, then referring to the recording where necessary, then noting down any immediate conclusions I could draw outside of the project framework - things I could learn from and change the way I worked because of. I didn't write these down as part of the notes from the interview because I didn't want to bias the analysis in any way - I just wrote ideas down elsewhere for my own use. 

Conclusions

I absolutely loved doing the fieldwork for this project. It was fantastic. I learned so much, I deepened existing relationships, and I got to know staff really well who I'd barely met before. Every time I came away from an interview I was absolutely buzzing. 

I don't think everyone enjoyed it as much as I did. Some people felt like they didn't know enough about a subject's research project to be able to ask intelligent questions about it - personally I just asked unintelligent questions until I got it - and there was the odd instance of the conversation being stilted or awkward. For me and a lot of my colleagues, though, it was eye-opening and actually really exciting. 

The question of what we do next - how we process all the data, and then act on what we learn - is covered in the following post.

What is UX and how can it help your organisation?

User Experience - UX - is still relatively new to libraries. I've been writing about it a lot on here of late: there's now been 4 posts in the Embedding Ethnography series about what we're doing at York.

I thought it would be useful take a step back and create a slide-deck to introduce UX - ethngraphy and design - in this context. Here it is:

One of the most popular pages on this site is the Structured Introduction to UX and Ethnography and I wanted something to go on there, and also for a new blog from the University of York.

Introducing Lib-Innovation

The Lib-Innovation blog is an attempt to capture some of the more creative stuff we do at York, and especially as a channel to disseminate ideas and results around our UX activities.  I'm reposting my own articles from Lib-Innovation on here, but not those written by my colleagues: if you're interested in the results of the UX studies I've written about on here so far, the Head of Relationship Management at York, Michelle Blake, has written about the projects on Lib-Innovation. What we learned what absolutely fascinating and we've already started to make the changes to help both students and staff.

More on UX

Here is a (continually updated) list of the latest posts on this blog that feature User Experience in some way.